Quality Control
that makes sense
Our QC solutions give operators the statistics, measurements, and analysis they need to assess media with efficiency and precision. Whether working in SDR or HDR (including Dolby Vision and DCI-P3), resolutions up to 8K, or multi-channel and immersive audio formats, our tools are built to match the complexity of today’s workflows.
MONITOR
ANALYSE
QUALIFY
COMPARE
VALIDATE
VISUALIZE
Monitor Every Detail with Advanced Video & Audio Scopes
Gain full control over your video and audio with detailed statistics and in-depth measurements provided by our advanced scopes.
Each scope offers a variety of visualization styles, making it easy to interpret complex data at a glance. Scopes are designed for maximum readability and can be arranged flexibly — either grouped together on a second monitor or displayed as floating windows in single-screen mode, giving operators complete freedom to customize their workspace
Extended toolset of VIDEO Scopes
Live video scopes that automatically adapt to the chosen color space, with out-of-gamut alerts and mastering display indications for precise, real-time monitoring.
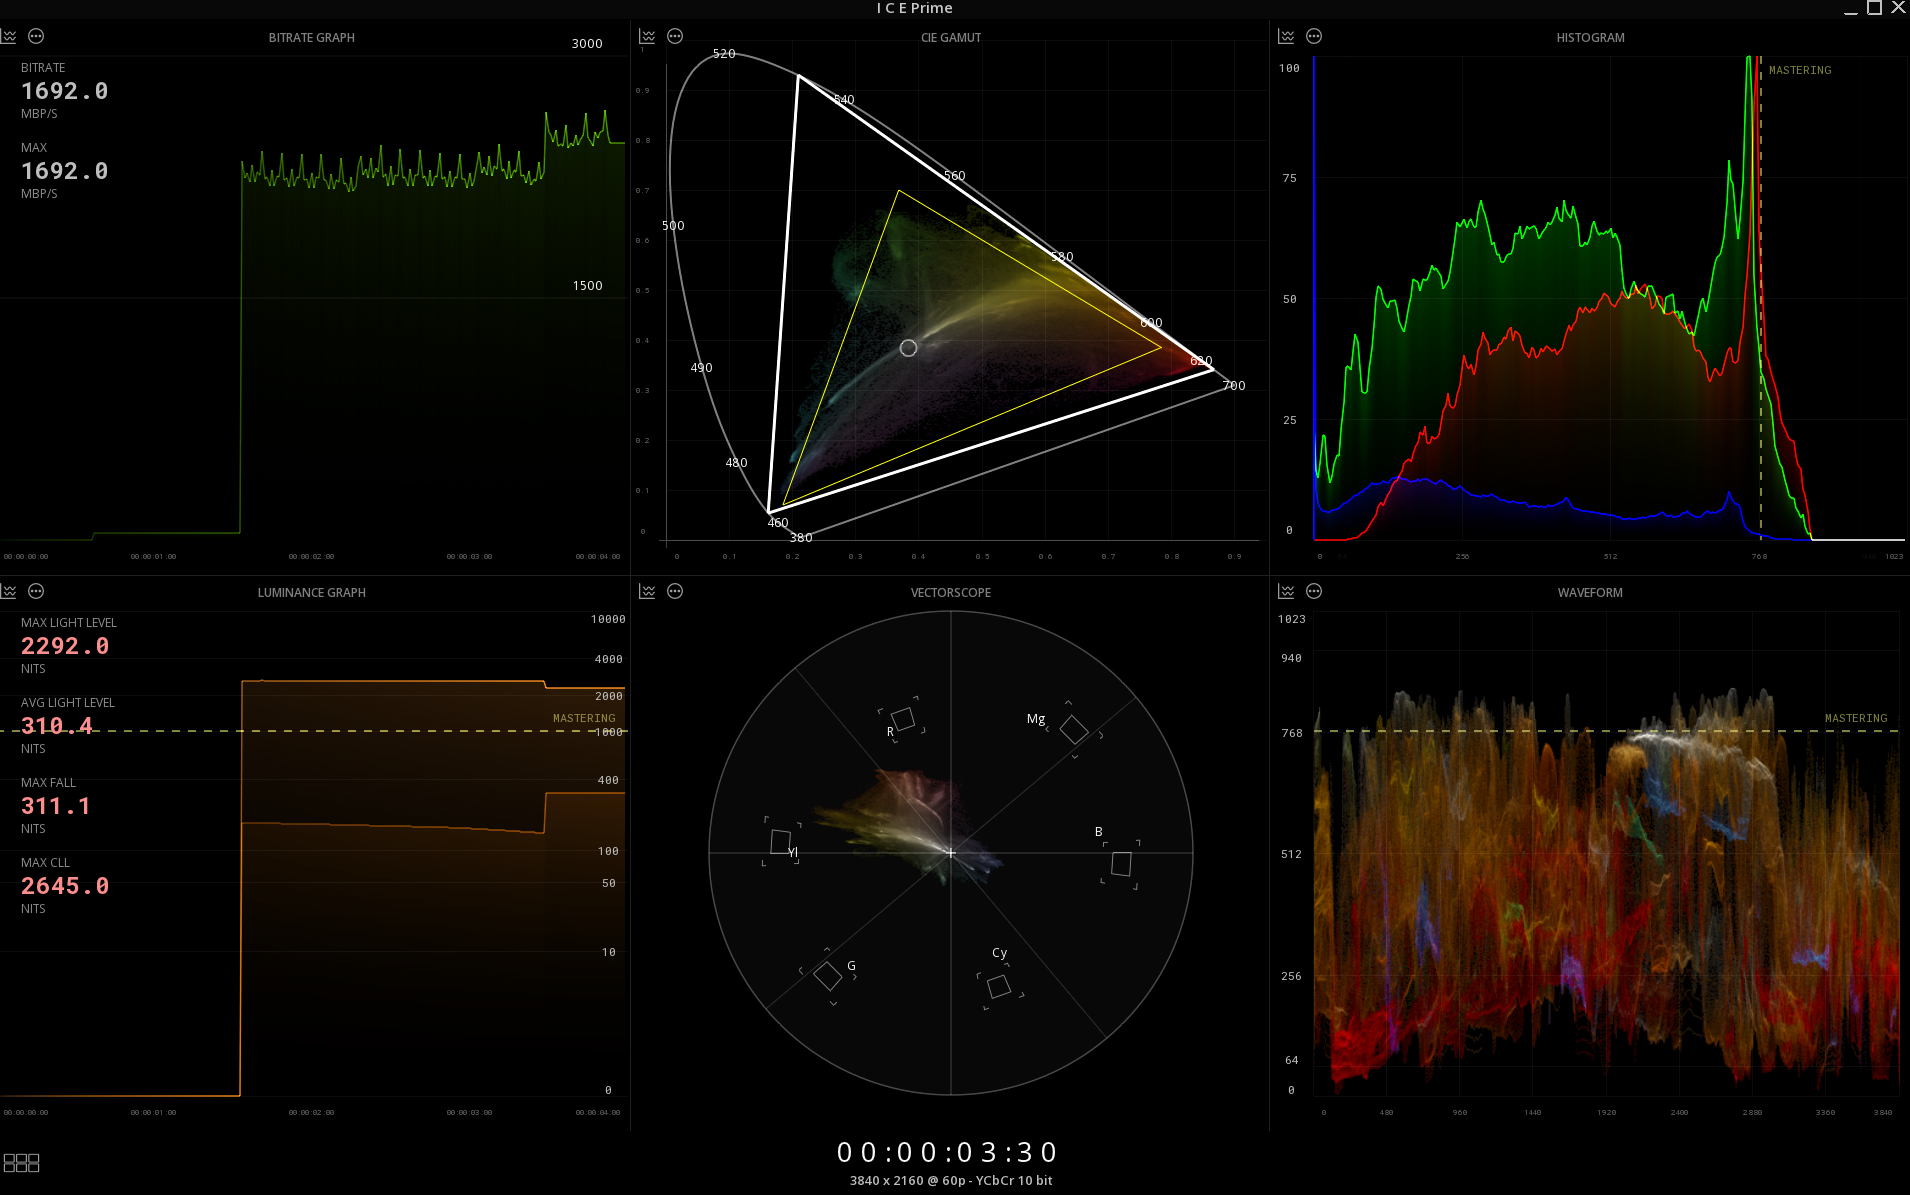

CIE Gamut
Visualize the full range of colors perceptible to the human eye with the CIE Gamut scope, mapping your media’s color on a 2D chromaticity plane. Ideal for monitoring color accuracy and compliance for SDR, HDR and cinema workflows.
- CIE 1931 or CIE 1976 modes – choose the style that fits your workflow
- Out-of-gamut indicators – highlight colors outside the mastering display or the safe gamut
- Gamut limits overlay – show triangles for the color space, mastering display, and safe gamut
- White point display – visualize and verify the reference white point

Video Waveform
The Video Waveform is a scope that visualizes a video signal’s brightness levels, helping operators monitor exposure and detect potential issues during production and post-production. The horizontal axis represents the frame from left to right, while the vertical axis represents pixel luminance, from black at the bottom to white at the top.
- Display styles – Luma, Luma+Chroma, RGB Overlay, RGB Split, RGB Split (Monochrome), YRGB Split, YCbCr Split, YCbCr Split (Monochrome)
- Out-of-gamut indicators – for quick compliance checks
- Flexible scales – IRE, mV, Nits, or Code Values (8, 10, 12, 16-bit) with auto-sizing to match the media
- Pixel sampling – show/hide the cursor location for precise measurement
- Mastering Display reference – for accurate HDR evaluation

Vectorscope
The Video Vectorscope provides a visualization of chrominance, plotting the Cb and Cr channels to analyze color information and ensure accurate signal quality for broadcast and post-production workflows.
-
Color targets – 75% or 100% saturation
-
Out-of-gamut boundaries – choose from Color Space, Mastering Display, or Safe Gamut
-
Pixel position tracking – show/hide the cursor location for precise analysis
-
Display modes – real colors or monochrome for flexible monitoring

Histogram
The Video Histogram provides a clear, real-time view of your image’s tonal distribution, plotting pixel counts across RGB channels. Instantly assess the overall color balance of any frame.
-
RGB display options – view channels separately or overlayed
-
Pixel position tracking – show/hide cursor location for precise analysis
-
Video Legal Range indicators – ensure compliance with broadcast standards
-
Film Density references – optional overlay for film workflows
-
Multiple scales – IRE, mV, Nits, or Code Values (8, 10, 12, 16-bit)

Luminance Meter
The Luminance Meter is a live scope that provides real-time measurement of light levels in your video content, ensuring accurate HDR delivery. Use it to analyze luminance against metadata specifications, including MaxFALL and MaxCLL, for every frame.
- Detailed statistics – MaxFALL, MaxCLL, Maximum Light Level, Average Light Level
- Pixel position tracking – show/hide cursor location for precise analysis

Bitrate Meter
The Bitrate Meter is a live scope that monitors the encoded bit rate of your video content in real time, helping operators ensure consistent compression and delivery quality.
- Current frame bitrate – see the instantaneous bit rate
- Maximal & minimal bitrates – track peaks and troughs
- Average bitrate – evaluate overall encoding efficiency
- Flexible scale – 100 Mb/s to 6000 Mb/s
Pixel Inspector
The Pixel Inspector is a live, interactive tool that lets you inspect and sample individual pixels within any frame. Extract precise color information to maintain color consistency, match branding, or analyze values under varying lighting conditions.
- Color value display – RGB Normalized, Hexadecimal, Nits, or Code Values (8, 10, 12, 16-bit)
- Pixel area selection – 3×3, 7×7, or 15×15 pixels
- Manual or Automatic modes – Inspect a single area or lock it during playback
Heatmaps
The Heatmaps provide intuitive visual feedback directly on the image, helping operators quickly assess exposure, luminance distribution, and color gamut compliance. These overlays allow for immediate identification of issues that may not be visible to the naked eye, ensuring precise image control during grading, QC, and delivery.
- Signal Range highlights pixels that fall outside defined boundaries, displaying under-range values in blue and over-range values in red.
- Luminance Heatmaps translate brightness or channel values into predefined color scales, with modes such as Y Luminance, MaxRGB, and individual RGB channels.
- Out-of-Gamut Heatmap reveals pixels exceeding the safe color gamut, with intensity indicating the degree of overshoot.

AUDIO & NGA Scopes
Our Audio Scopes provide real-time, detailed monitoring for both traditional and Next Generation Audio (NGA) content.
Traditional audio scopes are linked to the audio routing, allowing operators to monitor individual channels or entire soundfields independently. Measurements exceeding selected targets are clearly indicated in red for immediate feedback.
NGA scopes, on the other hand, are timeline- and metadata-driven, measuring the output of the active audio track regardless of routing configuration. They support rendering engines such as Dolby Atmos, MPEG-H, and our internal MT Renderer, providing accurate insight into immersive and personalized audio content.
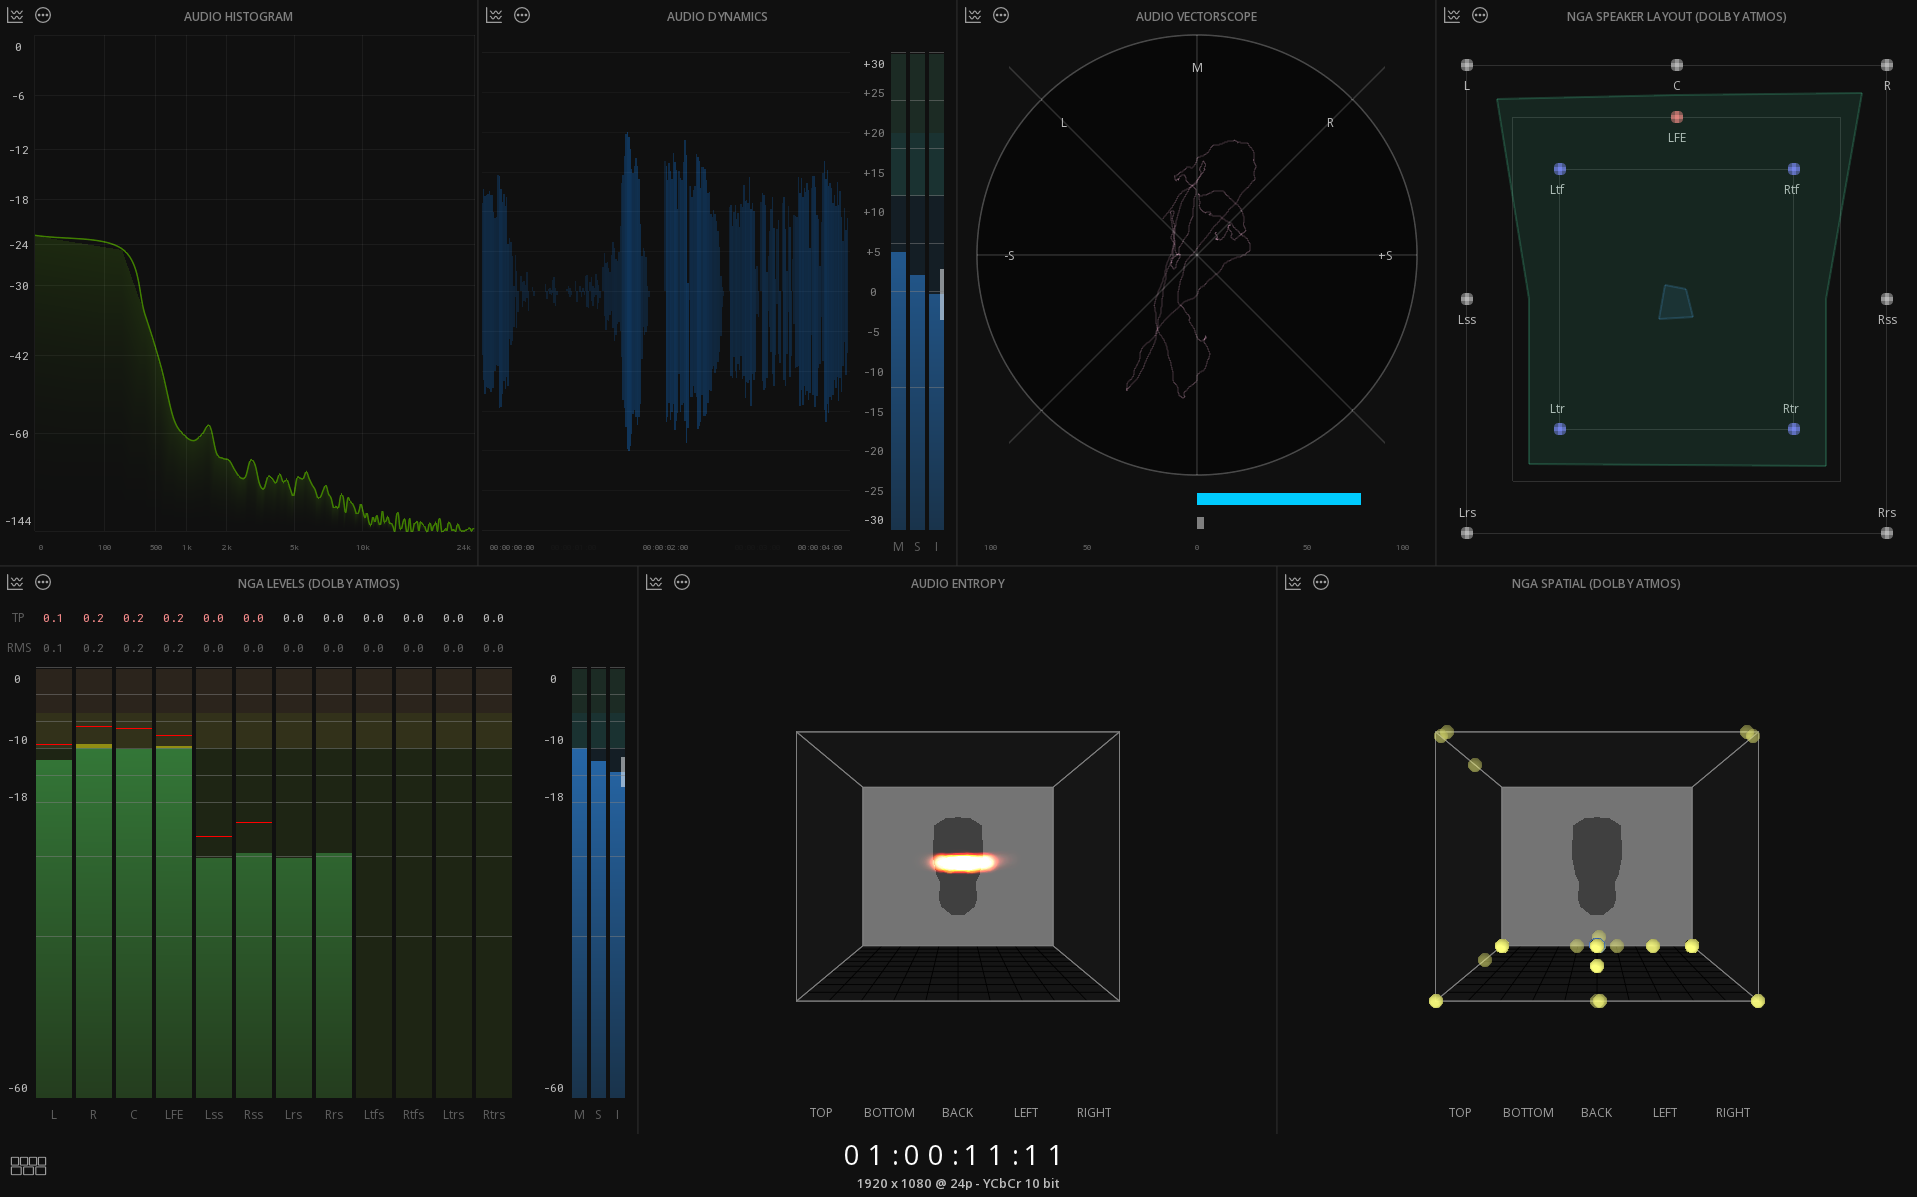
Audio Entropy
Audio Entropy is a groundbreaking, industry-first scope that works in parallel with NGA Spatial, providing a unique 3D representation of audio localization around the listener.
Unlike traditional object monitoring, it reveals how sound is truly rendered in space — capturing the actual amount of sound in space, independent of the objects metadata-defined movements.
This gives operators unrivaled insight into NGA content across any speaker layout, from stereo (2.0) to full 9.1.6 configurations.
- Automatic spatial or room layout based on file format
- Color-coded magnitude differences for clear visualization
- Head display – visualize listener perspective
- Full 3D positioning – rotate and inspect from every perspective
- Preset positions – quickly reset to Top, Bottom, Back, Left, Right views
NGA Spatial
NGA Spatial delivers a 3D visualization of the objects in an immersive audio soundfield, providing operators with a clear view of objects’ spatial positioning and movement.
The scope automatically adapts to the file format, displaying objects in polar coordinates or cartesian coordinates.
- Automatic spatial or room layout – based on file format
- Objects display – active and existing objects
- Head display – visualize listener perspective
- Full 3D positioning – rotate and inspect from every perspective
- Preset positions – quickly reset to Top, Bottom, Back, Left, Right views

Loudness Meter
The Loudness Meter provides real-time measurement of perceived audio loudness, taking into account intensity, frequency, and duration.
It displays results in LU or LUFS, reflecting how humans perceive volume. Operators can choose between Graph or Radar views for flexible monitoring.
- Display modes – Loudness Graph or Loudness Radar
- Gauges – Momentary, Short Term, Integrated, and Range
- Target display – show loudness targets for reference
- Standards support – EBU R128, AGCOM 219/09/CSP, ATSC A/85, ARIB TR-B32, FreeTV OP-59

Audio Levels
The Audio Levels scope provides real-time measurement of sound intensity in decibels (dB), giving operators precise control over audio dynamics.
- Auto Layout – VU meters reflect the different soundfields according to the timeline, supporting up to 16 channels.
- None Layout – VU meters display 16 mono channels, following the audio routing, ideal for testing individual channels or multiple soundfields simultaneously.
- File audio configuration detection – matches the multi-channel audio configurations automatically
- VU meters – compliant with EBU or SMPTE recommended practices
- Peak meters – True Peak and Sample Peak
- RMS meters – monitor average levels accurately
- Display scales – choose from 60, 96, or 144 dB
NGA Levels
The NGA Levels scope offers the same features as Audio Levels but measures the active audio track directly from the renderer (e.g., Dolby Atmos, MPEG-H, MT Renderer), rather than relying on the audio routing matrix.
It reflects the audio configuration used for rendering (e.g., 7.1.4, 5.1.4), providing precise insight into immersive and personalized audio.
- Automatic audio configuration detection – adapts to the audio rendering setup
- VU meters – compliant with EBU or SMPTE recommended practices
- Peak meters – True Peak and Sample Peak
- RMS meters – averaged over one frame
- Display scales – 60, 96, or 144 dB

NGA Program Map
The NGA Program Map is a unique, industry-first scope.
It allows operators to monitor and interact directly with ADM and Serial ADM audio Programs, acting as both a metadata inspector and a remote control. With this tool, you can select a specific program, adjust gain, and test personalization parameters — capabilities that traditional audio routing cannot provide for multi-program ADM tracks.
- Program Map – visualizes all Programs, Contents, and Objects, clearly outlined for immediate reference
- Tracks – displays the Logical or Physical channels associated with the selected program
- ADM metadata display – view program, content, and object information in real time
- Mute control – silence specific contents or objects
- Personalization testing – adjust gain and animation parameters for immersive audio

Soundfield
The Soundfield scope provides real-time analysis and visualization of audio signals in a surround sound environment, helping operators understand spatial distribution and maintain proper levels and relationships across channels (e.g., 5.1 or 7.1 mixes).
- High-quality Lissajous display – precise visualization of spatial distribution
- Surround support – 5.1 and 7.1 channel configurations
- Wideness and phantom position measurements – assess audio Wideness
NGA Loudspeaker Layout
The NGA Loudspeaker Layout provides a spatial visualization of speakers based on the audio configuration chosen for rendering. The layout information comes directly from the NGA track, ensuring accurate representation of the soundfield.
Depending on the NGA format, the layout is displayed according to Cartesian or Polar coordinates.
- Automatic diagram design – Polar or Cartesian layout based on NGA format
- Wideness measurements with phantom position – assess audio Wideness
- Head display – visualize listener perspective


Audio Vectorscope
The Audio Vectorscope provides a visual representation of the stereo image of a sound, plotting the amplitude of one channel against the other to help operators monitor phase, balance, and stereo width. It’s an essential tool for detecting issues such as mono compatibility problems or excessive stereo expansion.
- Phase correlation – monitor Left/Right correlation with min and max marks
- Balance display – evaluate Left/Right balance with min and max marks
- Channel selection – choose which pair of channels to analyze
- Display styles – continuous line or cloud of points
- Zoom function – scale up to 5× for detailed inspection

Audio Waveform
The Audio Waveform provides a real-time visual representation of audio amplitude over time, with the horizontal axis representing time and the vertical axis representing loudness. It allows operators to analyze, monitor, and adjust audio levels accurately, with a time scale of one frame depending on the frame rate.
- Zoom function – adjust from 1:1 up to 5:1 for detailed inspection

Audio Dynamics
The Audio Dynamics scope visualizes the range between the quietest and loudest parts of an audio signal in decibels (dB). It helps operators understand the dynamic contrast within a track and is particularly useful for measuring signal loss between a master and an encoded version.
- PLR or PSR analysis – assess peak-to-loudness or peak-to-integrated-loudness relationships
- Loudness MSI gauges – monitor Loudness metrics in real time
- Loudness statistics – view detailed quantitative information for precise analysis

Audio Histogram
The Audio Histogram is an audio spectrum analyzer that breaks down a signal into its constituent frequencies and displays their amplitudes, creating a “frequency fingerprint” of the sound. It helps operators identify noise, isolate problem areas, and compare mixes to reference tracks for precise audio analysis.
- Scale options – display in LU or LUFS
Headphone monitoring
All our solutions feature a dedicated headphone output for precise monitoring. The output can be configured as Binaural or 2.0 stereo, depending on your workflow.
- NGA monitoring: when the active NGA track is selected, the headphone output reflects the rendering of the active engine (Dolby Atmos, MPEG-H, or MT Renderer).
- Audio Routing monitoring: when an audio routing bus is selected, the headphone output is produced by the MT Renderer, with binaural support for all surround configurations
This ensures accurate and flexible monitoring for both traditional and immersive audio workflows.
In-Depth Audio & Image Analysis
Audio and Video offline analysis
ICE Studio and MIST provide powerful tools for offline analysis of video and audio bitstreams, with track management, helping operators ensure the highest quality before delivery.
Freeze Frame & Black Frame Detection – identify unintended still frames or black frames in the video.
- Dead Pixel Detection – locate and report dead pixels across sequences.
- Luminance Analysis – evaluate brightness levels across the image for consistency and compliance with HDR standards (MaxFALL, MaxCLL).
- Loudness Measurement – measure audio levels according to international standards: EBU R128, AGCOM 219/09/CSP, ATSC A/85, ARIB TR-B32, FreeTV OP-59.
- Audio Drop Detection – detect gaps or missing segments in audio streams.
- Comparative Analysis – quantify differences between sources using ΔICTCP (color difference) or PSNR (Peak Signal-to-Noise Ratio).


Timeline Graph
Once analyses are complete, the Timeline Graph displays the results of video and audio quality checks directly within the timeline context. Operators can examine measurements such as Loudness, PSNR, Bitrate, and Luminance, including MaxFALL and MaxCLL, with precision ranging from the entire program length down to individual frames.
The Timeline Graph also supports the import of external data in CSV, such as PSE Harding tests, integrating third-party results into a single, consolidated view.
Display of the results in the timeline
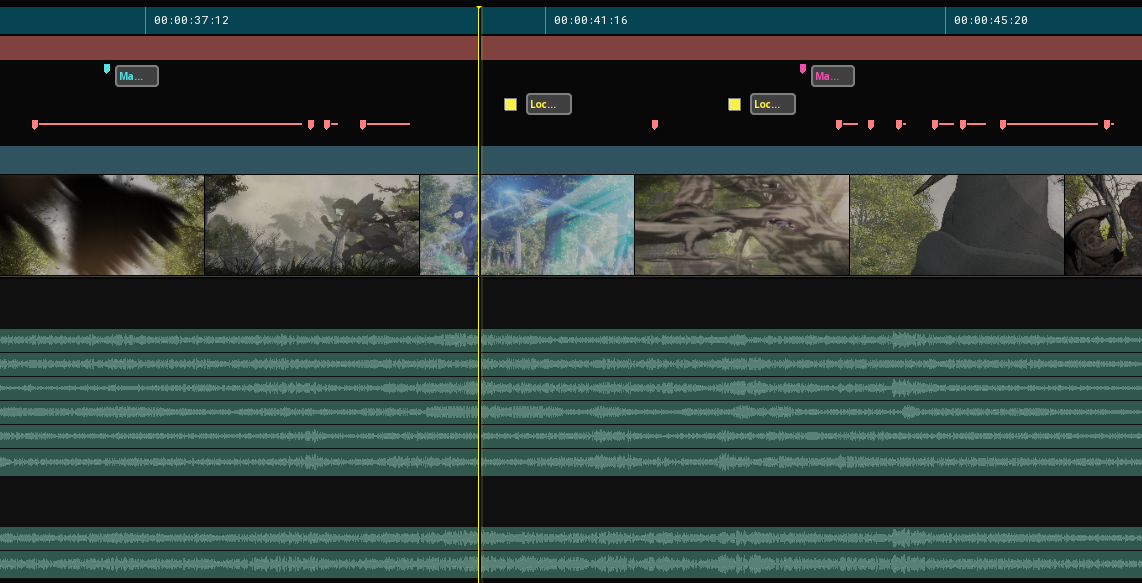
The QC Anomalies Track provides immediate, visual feedback of errors directly on the timeline, making it easy to locate and assess issues across the content.
Sources of reported anomalies include:
- Results from Offline Analysis – automatically detected video and audio issues.
- External Automated QC Tool Reports – import and display XML reports from third-party QC systems.
- EBU-QC XML Reports – support for the open-source, standardized QC exchange format.
- Manual Reporting – add notes and flag errors directly within the timeline.
Support for Automated QC tools
Support for Automated QC tools include:
- Aurora
- Baton
- Pulsar / Quasar
- Vidchecker
- QScan
Interactive Errors Qualification
Combine automated checks with human expertise through powerful interactive QC tools, fully integrated with EBU-QC standards.
Enrich & Qualify QC Reports
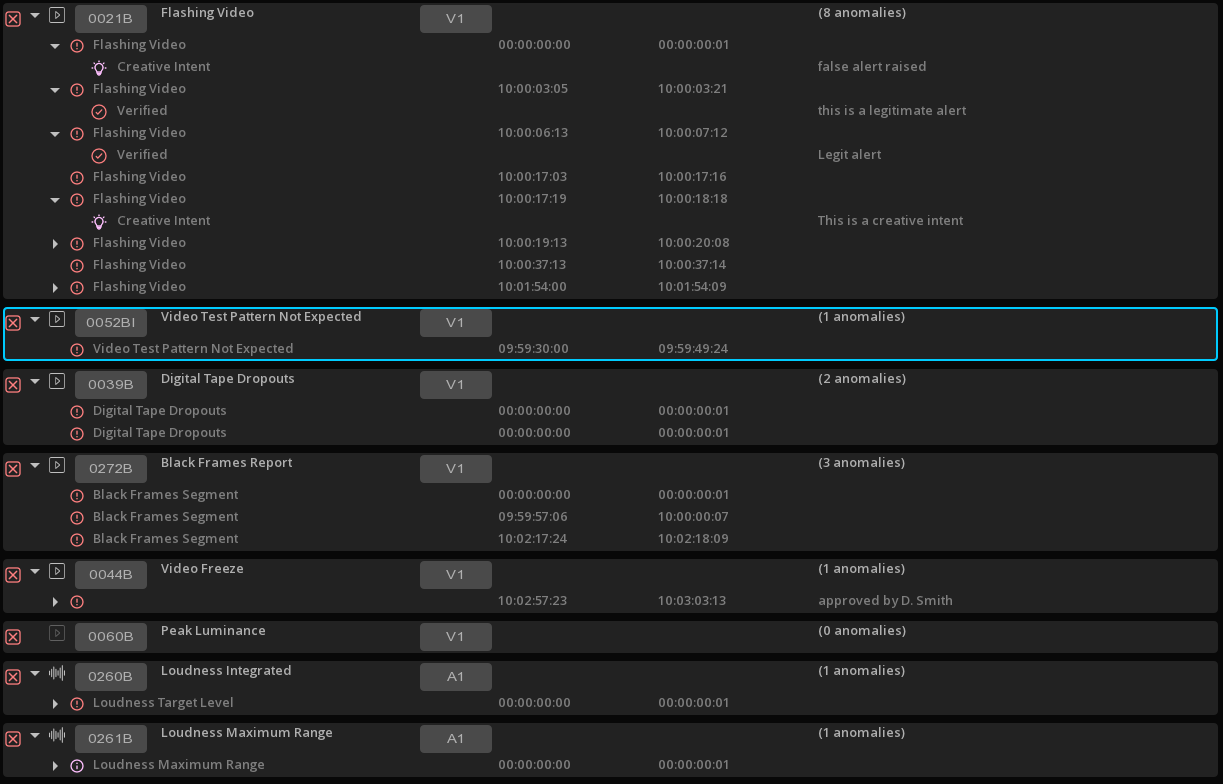
Reports from automated, file-based QC solutions can be imported, with errors displayed both in the QC tool page and directly on the timeline, allowing operators to navigate from issue to issue and review them in context.
Results from offline analyses performed by MIST and ICE Studio are listed in the same way, ensuring a unified view of all detected anomalies.
Each anomalie can then be qualified as “Creative Intent,” “Verified Error,” or “False Positive,” with optional custom comments. Finally, a consolidated report can be exported in both EBU-QC XML and PDF formats.

Eyeball QC
Perform Golden Eye and Golden Ear analysis by marking the location and duration of issues directly on the timeline.
Each issue can be tagged with a standardized EBU-QC code, ensuring a clear and unambiguous vocabulary across teams and tools.
With access to the complete EBU-QC catalogue of more than 350 test definitions, operators can accurately identify and classify errors with confidence.
Work with QC Profiles
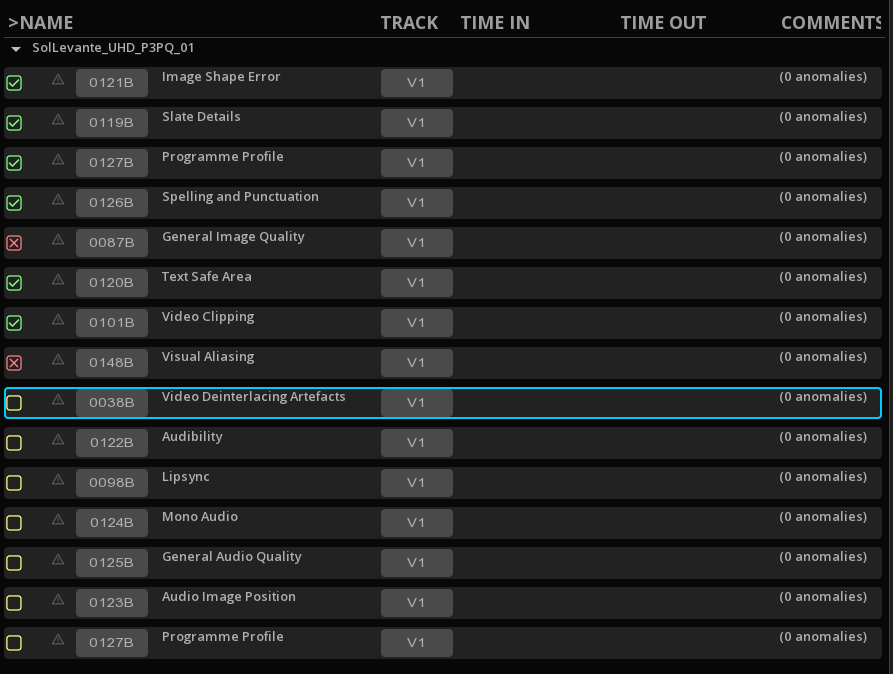
Checklists of Eyeball QC verifications, each linked to an EBU-QC code, can be saved into reusable Profiles.
Importing a profile into a new project automatically lists all required human-only tests in the QC tool.
Results can be instantly marked as PASS or FAIL, with optional comments before exporting the finalized report, enabling faster, standardized, and fully documented QC.
Real-Time Annotations
MIST and ICE Studio support multiple levels of real-time annotations, giving operators flexibility in how issues and notes are tracked during QC.
-
QC Markers – displayed directly on the timeline, these markers reflect errors reported by third-party QC tools or offline analyses and are linked to the QC Tool page. They are designed for export or for archiving alongside the media.
-
Locators – managed on a dedicated track and page, locators are intended for internal use.
Locators Track
The Locators Track lets operators instantly mark specific points on the timeline with comments or to-dos. Designed for internal notes and custom annotations, these locators can be exported as an XML file for further review or action.
The Event Viewer can also display a dedicated Locators view, allowing operators to focus exclusively on the annotated events.

Master & Versions Comparison
Unrivaled tools for comparing and analysing the encoded versions against the original master, or different versions of the same title.
Dual Timeline, dual Image Viewport, dual Video Outputs
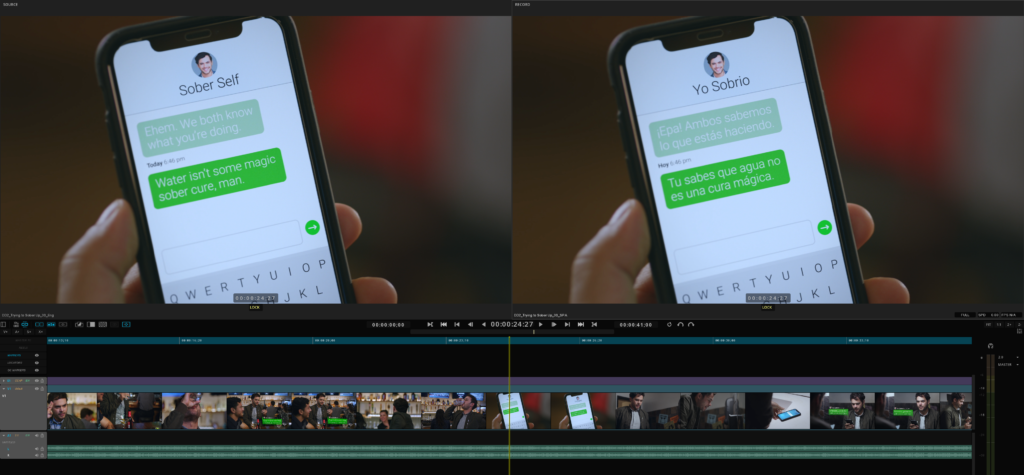
MIST and ICE Studio are the only solutions that deliver true dual comparison playback of two different sources. Any format—IMF, DCP, MXF masters, image sequences, or any saved compositions—can be loaded interchangeably on the two timelines, displayed across two independent viewports, and output simultaneously to dual video interfaces.
- Both timelines are format-agnostic and resolution-independent.
- Each viewport supports independent color management (tone mapping, color space conversion) and can switch seamlessly into diagnostic heatmap modes.
- Dual video output is supported up to 4K at 60 fps.
- Vertical and Horizontal Comparison wipes
- Comparisons can be saved as reference of a composition, preserving the comparison set up for future reviews.
Master-to-Encode Linking
For streaming and multi-version workflows, entire packages of encoded derivatives can be imported and linked directly to the master. This allows frame-accurate, synchronized playback across the master and all encodes, enabling comprehensive pyramidal inspection and absolute confidence in quality control.
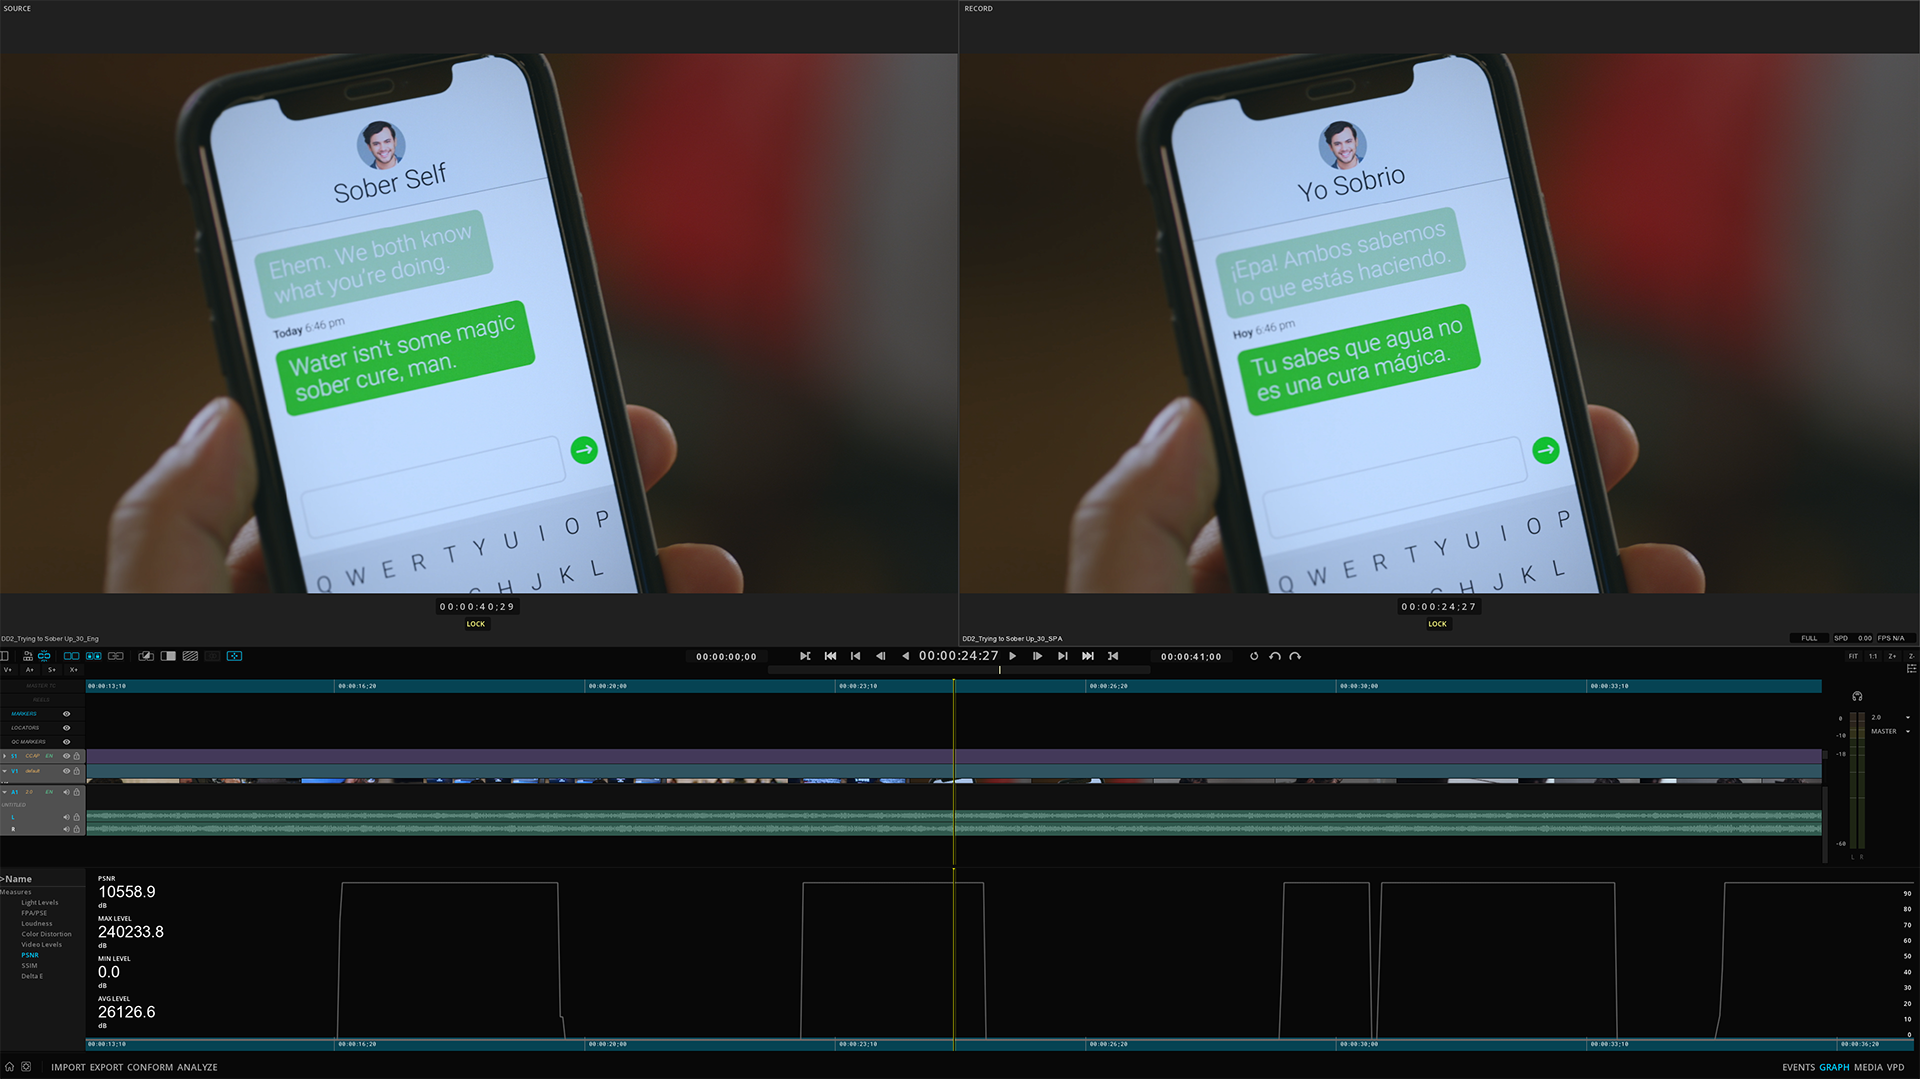
Delta Map
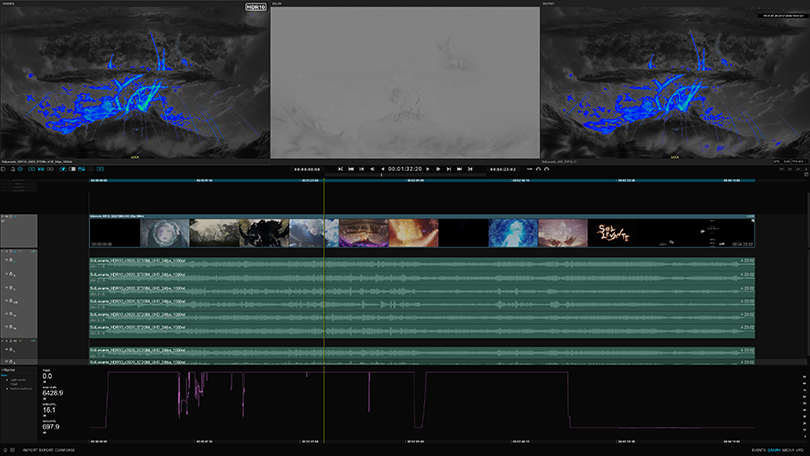
ICE Studio stands apart with its unique Delta Map—an exclusive third viewport that instantly reveals the differences between two images with absolute clarity.
The Delta Map provides a direct visual representation of deviations between two images, highlighting even the smallest variations that might escape the eye.
Multiple analysis modes are available, ensuring operators can precisely quantify and qualify discrepancies between sources:
- Image difference, Signed or Absolute
- Blend mode
- Horizontal, Vertical and Mesh Interlaced
- Anaglyphe modes
Comparative Analysis
Perform precise, quantitative comparisons between two media sources using advanced metrics such as PSNR (Peak Signal-to-Noise Ratio) and Color Difference analysis (ΔICTCP).
Results are presented in clear graphical form for immediate interpretation in the context of the timeline and can be seamlessly exported as detailed reports in CSV or XML formats for further documentation and sharing.
Validate a large variety of master and distribution files
Compliancy tests and validations are available for a large variety of masters, including DCP and IMF packages.
Results are available in the form of PDF or XML reports.
DIGITAL CINEMA
- DCP SMPTE-A, B v2.0, B v2.1
- DCP HDR
- Dolby Cinema
- IMF App 4 (Cinema Mezzanine)
- IMF App 5 (ACES)
BROADCAST
- AS-02, AS-10, AS-11
- MXF Repository file
- RDD 59-1 and 59-2 IMF Application DPP
- XDCAM, XAVC
- HDR10, HDR10+, Dolby Vision, HLG
ONLINE
- IMF App 2e (Studio Profile)
- MKV (YouTube)
- MXF op1a and MXF op1b
- HDR10, HDR10+, Dolby Vision



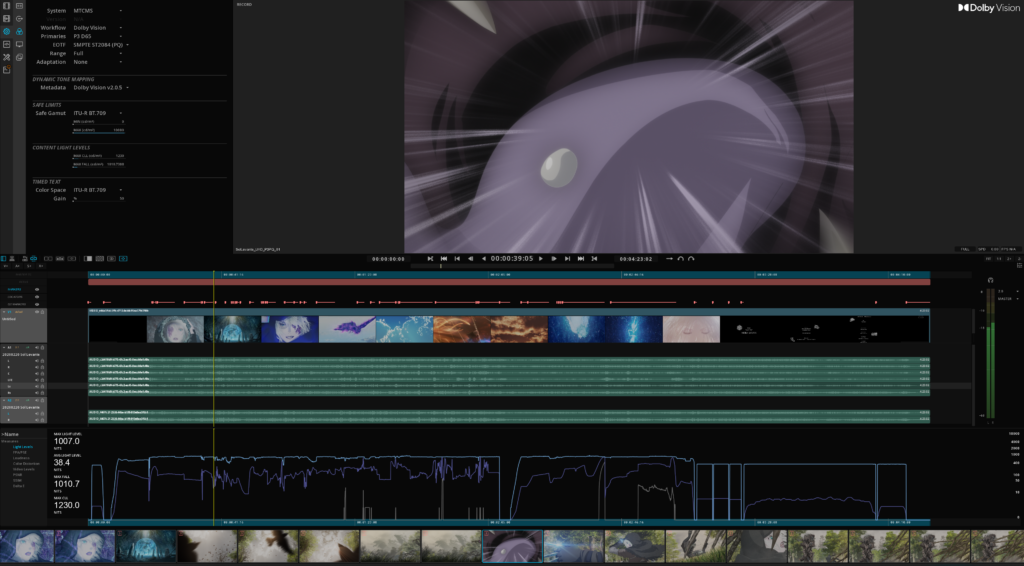
Visualize all at once
ICE Studio and MIST provide multiple ways to visualize image, tracks, errors, annotations, and content structure, giving operators the flexibility to inspect and navigate media in the way that best suits their workflow.
The Event Viewer
The Event Viewer provides a powerful alternative to traditional timeline inspection, displaying content as a succession of events rather than a chronology.
This approach enables operators to instantly focus only on segments of interest, making it faster and easier to identify, assess, and act on issues without navigating through unaffected content.
Depending on the workflow, the Event Viewer can display different types of events, including:
-
QC Markers – visualize only the sections flagged with anomalies.
-
Dolby Vision Shots – inspect the continuity of dynamic metadata shot by shot.
-
Locators – review events with custom comments or to-dos.
-
Markers – jump directly to the first frame of action, commercial breaks, or other SMPTE markers.
-
Reels – embrace the content structure for clear context and fast navigation.
-
Video Clips – gain a scene-by-scene overview of the content.

Subtitles Inspection
A perfect rendering of all type of subtitles, including IMSC1, XML SMPTE, EBU STL:
- Control of the subtitles using the spotting list
- Text luminance management


